import pandas as pd

df = pd.DataFrame({
    'name': ["Tom", "Lisa", "Peter"],
    'height': [1.68, 1.93, 1.72],
    'weight': [48.4, 89.8, 84.2],
    'id': [1, 2, 3],
    'city': ['Stuttgart', 'Stuttgart', 'Berlin']
})

df['bmi'] = round(df['weight'] / (df['height'] * df['height']), 2)
df["name"] = df["name"].astype("category")
df['id'] = df['id'].astype(str)Statistics and Plots
Pandas Introduction
Jan Kirenz
Setup
Numeric Data
Mean
- We can calculate simple statistics like the mean
Formatted string literals
- Print the value in nice format (using formatted string literals f”…“)
Median and Standard Deviation
1.72Describe
- describe() shows a quick statistic summary of your numerical data.
Describe with transpose
| count | mean | std | min | 25% | 50% | 75% | max | |
|---|---|---|---|---|---|---|---|---|
| height | 3.0 | 1.78 | 0.13 | 1.68 | 1.70 | 1.72 | 1.82 | 1.93 |
| weight | 3.0 | 74.13 | 22.46 | 48.40 | 66.30 | 84.20 | 87.00 | 89.80 |
| bmi | 3.0 | 23.24 | 5.70 | 17.15 | 20.63 | 24.11 | 26.28 | 28.46 |
Describe for specific columns with groupby
- Summary statistics for numeric variables
heightandbmifor different levels of the categorical variablecity:
Categorical Data
Example
- we can also use
describe()for categorical data
Show unique levels
- Show unique levels of a categorical variable and count with
value_counts()
Extract specific values
- We also can extract specific values
2Formatted string literals
- Print the value in nice format (using formatted string literals f”…“)
Loop over List
Statistics for specific columns
- Example of for loop to obtain statistics for specific numerical columns
Summary statistics
- Calculate summary statistics for our list.
Column: height
  count    3.00
mean     1.78
std      0.13
min      1.68
25%      1.70
50%      1.72
75%      1.82
max      1.93
Name: height, dtype: float64

Column: weight
  count     3.00
mean     74.13
std      22.46
min      48.40
25%      66.30
50%      84.20
75%      87.00
max      89.80
Name: weight, dtype: float64
Create Plots
Setup
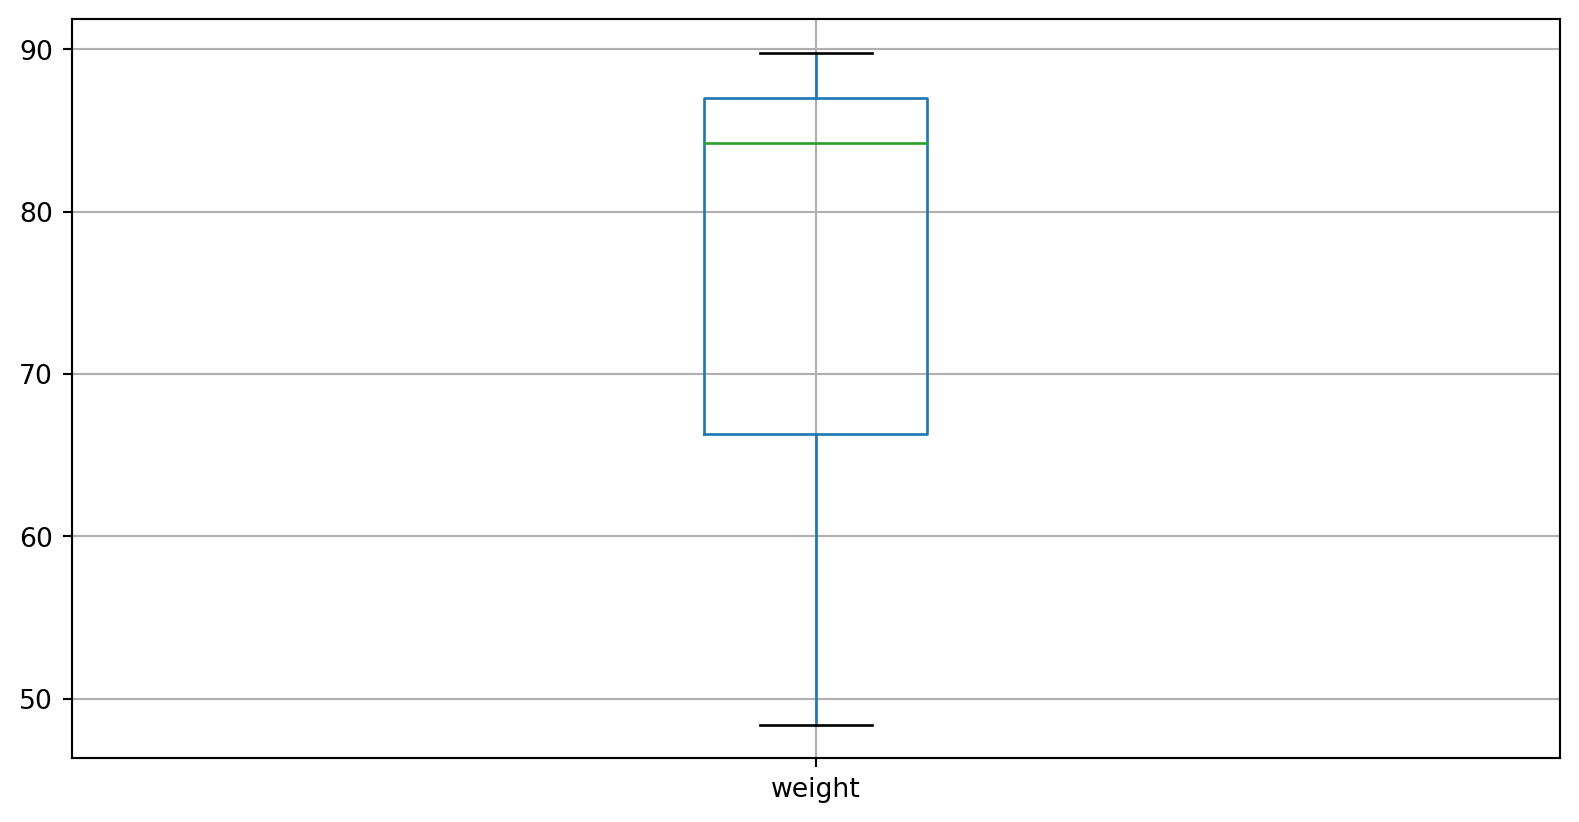
One boxplot
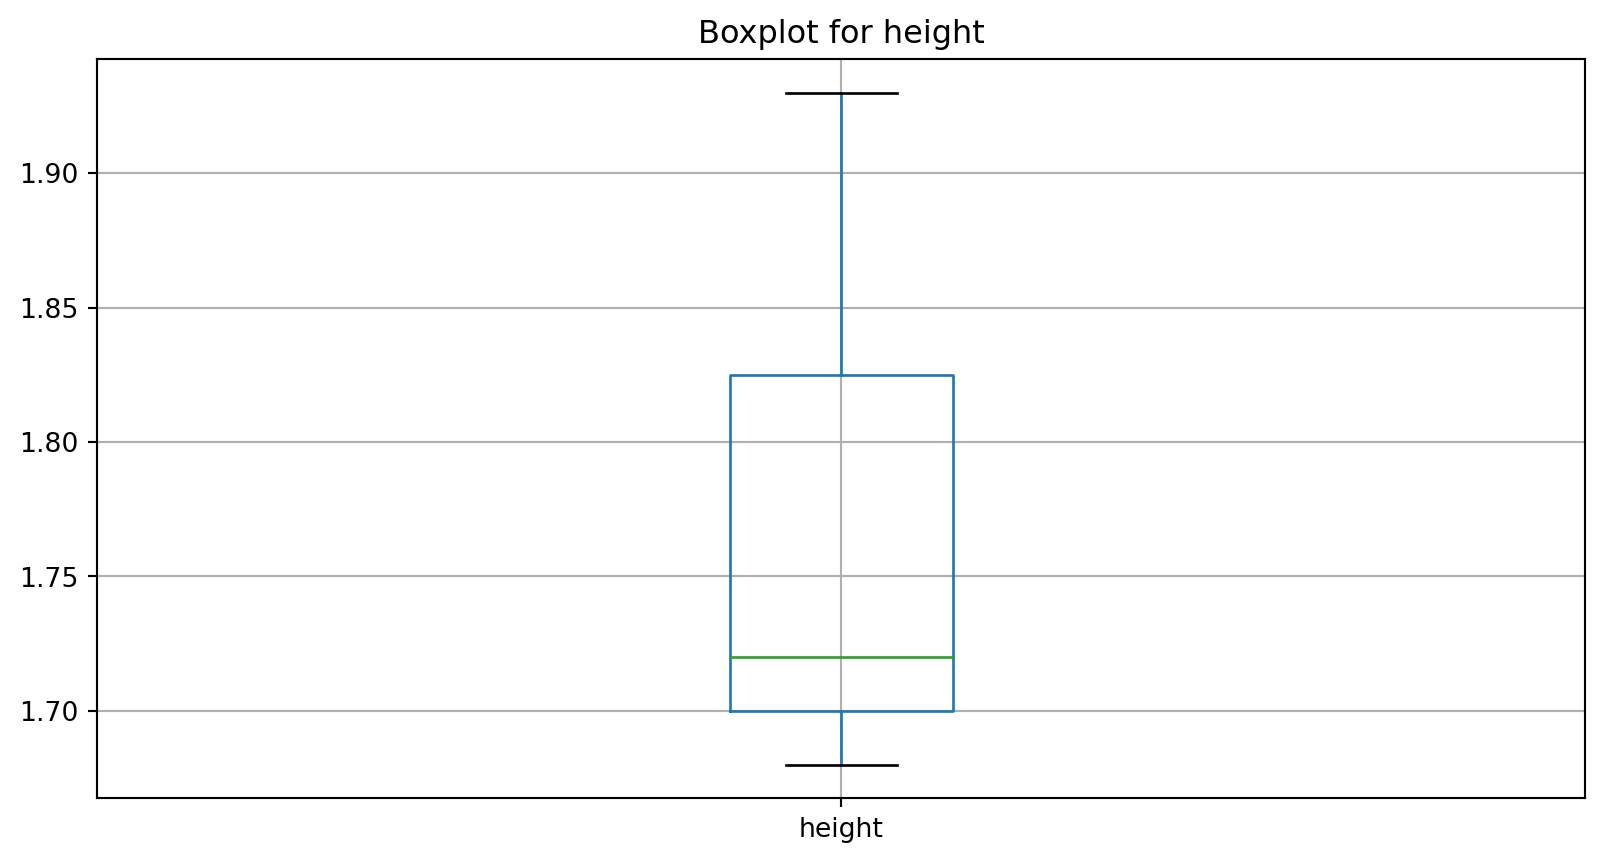
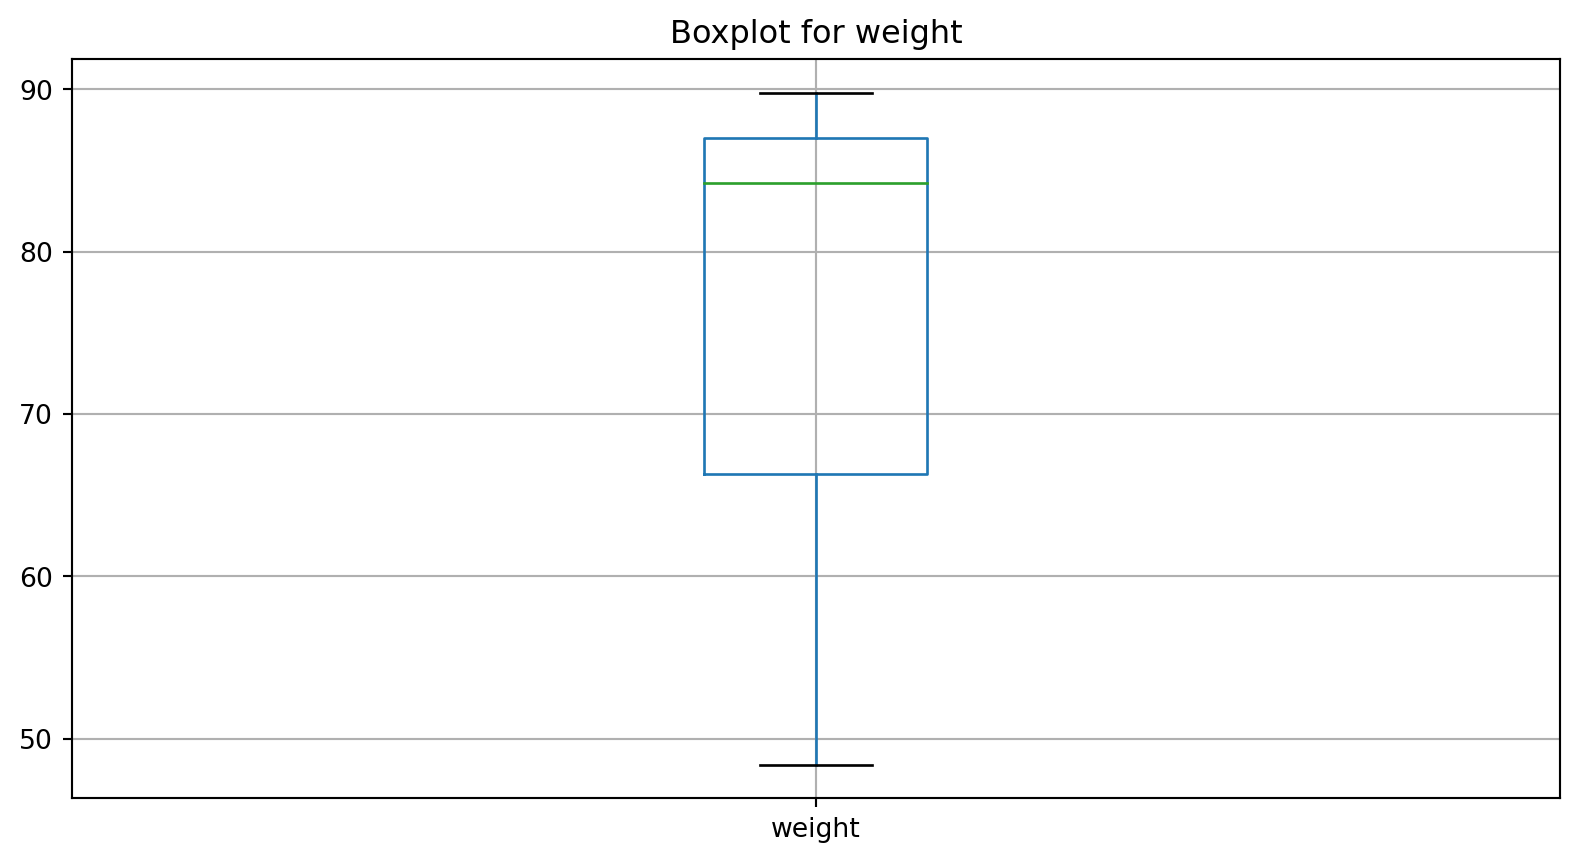
Multiple boxplots with loop
What’s next?
Congratulations! You have completed this tutorial 👍
Next, you may want to go back to the lab’s website
Jan Kirenz