Marketing Campaign Response Prediction
Using Gradient Boosted Trees
Introduction

- Predict the response to a marketing campaign
Example Payback

Marketing use case
- The goal is to predict if
- a customer
- will respond positively (e.g. buys a product)
- to a future campaign
- based on their features
- We use data from previous campaigns to train a model
Boosting: An Intuitive Introduction
Overview
Boosting is an ensemble learning method
Combines multiple weak learners to build a strong classifier
Learners are trained sequentially
Each learner focuses on correcting the mistakes of its predecessor
Intuition
Begin with a weak learner that performs slightly better than random guessing
Train a new weak learner to correct the mistakes of the previous one
Repeat the process, focusing on different error patterns each time
Combine all weak learners into a strong classifier
Difference to Bagging
- Bagging:
- Learners are trained independently
- Training samples are drawn with replacement (bootstrapping)
- Combines learners by averaging (regression) or voting (classification)
- Boosting:
- Learners are trained sequentially
- Emphasis is placed on misclassified instances
- Combines learners by weighted averaging
Advantages of Boosting
Can achieve high accuracy with simple weak learners
Less prone to overfitting than single models
Can be applied to various learning algorithms
Disadvantages of Boosting
Sensitive to noise and outliers
Computationally expensive due to sequential training
Can overfit if weak learners are too complex
Code example
Data overview
age: Customer’s age (integer)city: Customer’s place of residence (string: ‘Berlin’, ‘Stuttgart’)income: Customer’s annual income (integer)membership_days: Number of days the customer has been a member (integer)campaign_engagement: Number of times the customer engaged with previous campaigns (integer)target: Whether the customer responded positively to the campaign (0 or 1)
Import data
Data overview
| age | city | income | membership_days | campaign_engagement | target | |
|---|---|---|---|---|---|---|
| 0 | 56 | Berlin | 136748 | 837 | 3 | 1 |
| 1 | 46 | Stuttgart | 25287 | 615 | 8 | 0 |
| 2 | 32 | Berlin | 146593 | 2100 | 3 | 0 |
| 3 | 60 | Berlin | 54387 | 2544 | 0 | 0 |
| 4 | 25 | Berlin | 28512 | 138 | 6 | 0 |
| ... | ... | ... | ... | ... | ... | ... |
| 995 | 22 | Berlin | 49241 | 2123 | 4 | 0 |
| 996 | 40 | Stuttgart | 116214 | 970 | 5 | 1 |
| 997 | 27 | Stuttgart | 64569 | 2552 | 6 | 0 |
| 998 | 61 | Stuttgart | 31745 | 2349 | 8 | 1 |
| 999 | 19 | Berlin | 46029 | 2185 | 2 | 0 |
1000 rows × 6 columns
Data info
<class 'pandas.core.frame.DataFrame'>
RangeIndex: 1000 entries, 0 to 999
Data columns (total 6 columns):
 #   Column               Non-Null Count  Dtype
---  ------               --------------  -----
 0   age                  1000 non-null   int64
 1   city                 1000 non-null   object
 2   income               1000 non-null   int64
 3   membership_days      1000 non-null   int64
 4   campaign_engagement  1000 non-null   int64
 5   target               1000 non-null   int64
dtypes: int64(5), object(1)
memory usage: 47.0+ KB
Data corrections
- Encode categorical variables
<class 'pandas.core.frame.DataFrame'>
RangeIndex: 1000 entries, 0 to 999
Data columns (total 7 columns):
 #   Column               Non-Null Count  Dtype
---  ------               --------------  -----
 0   age                  1000 non-null   int64
 1   income               1000 non-null   int64
 2   membership_days      1000 non-null   int64
 3   campaign_engagement  1000 non-null   int64
 4   target               1000 non-null   int64
 5   city_Berlin          1000 non-null   uint8
 6   city_Stuttgart       1000 non-null   uint8
dtypes: int64(5), uint8(2)
memory usage: 41.1 KB
Data splitting
- Split the df into features (X) and target (y)
Select model
- Define hyperparameters as dictionary
n_estimators: Number of gradient boosted treesmax_depth: Maximum tree depthmin_samples_split: The minimum number of samples required to split an internal node
Train model
- Train the model on the training data
GradientBoostingClassifier(min_samples_split=5, n_estimators=50)In a Jupyter environment, please rerun this cell to show the HTML representation or trust the notebook.
On GitHub, the HTML representation is unable to render, please try loading this page with nbviewer.org.
GradientBoostingClassifier(min_samples_split=5, n_estimators=50)
Evaluate model
- Predict on the testing data
Confusion matrix
- Print confusion matrix
Classification report
- Print classification report
Obtain feature importance
- Obtain feature importance
Plot feature importance
Save model
Summary
We trained a model
Our model makes a prediction if a customer will respond positively or not
The model does a good job and we want to use it
We saved the model
We want to use the model to target customers
How to use the model?
Dashboard & API
Streamlit dashboard
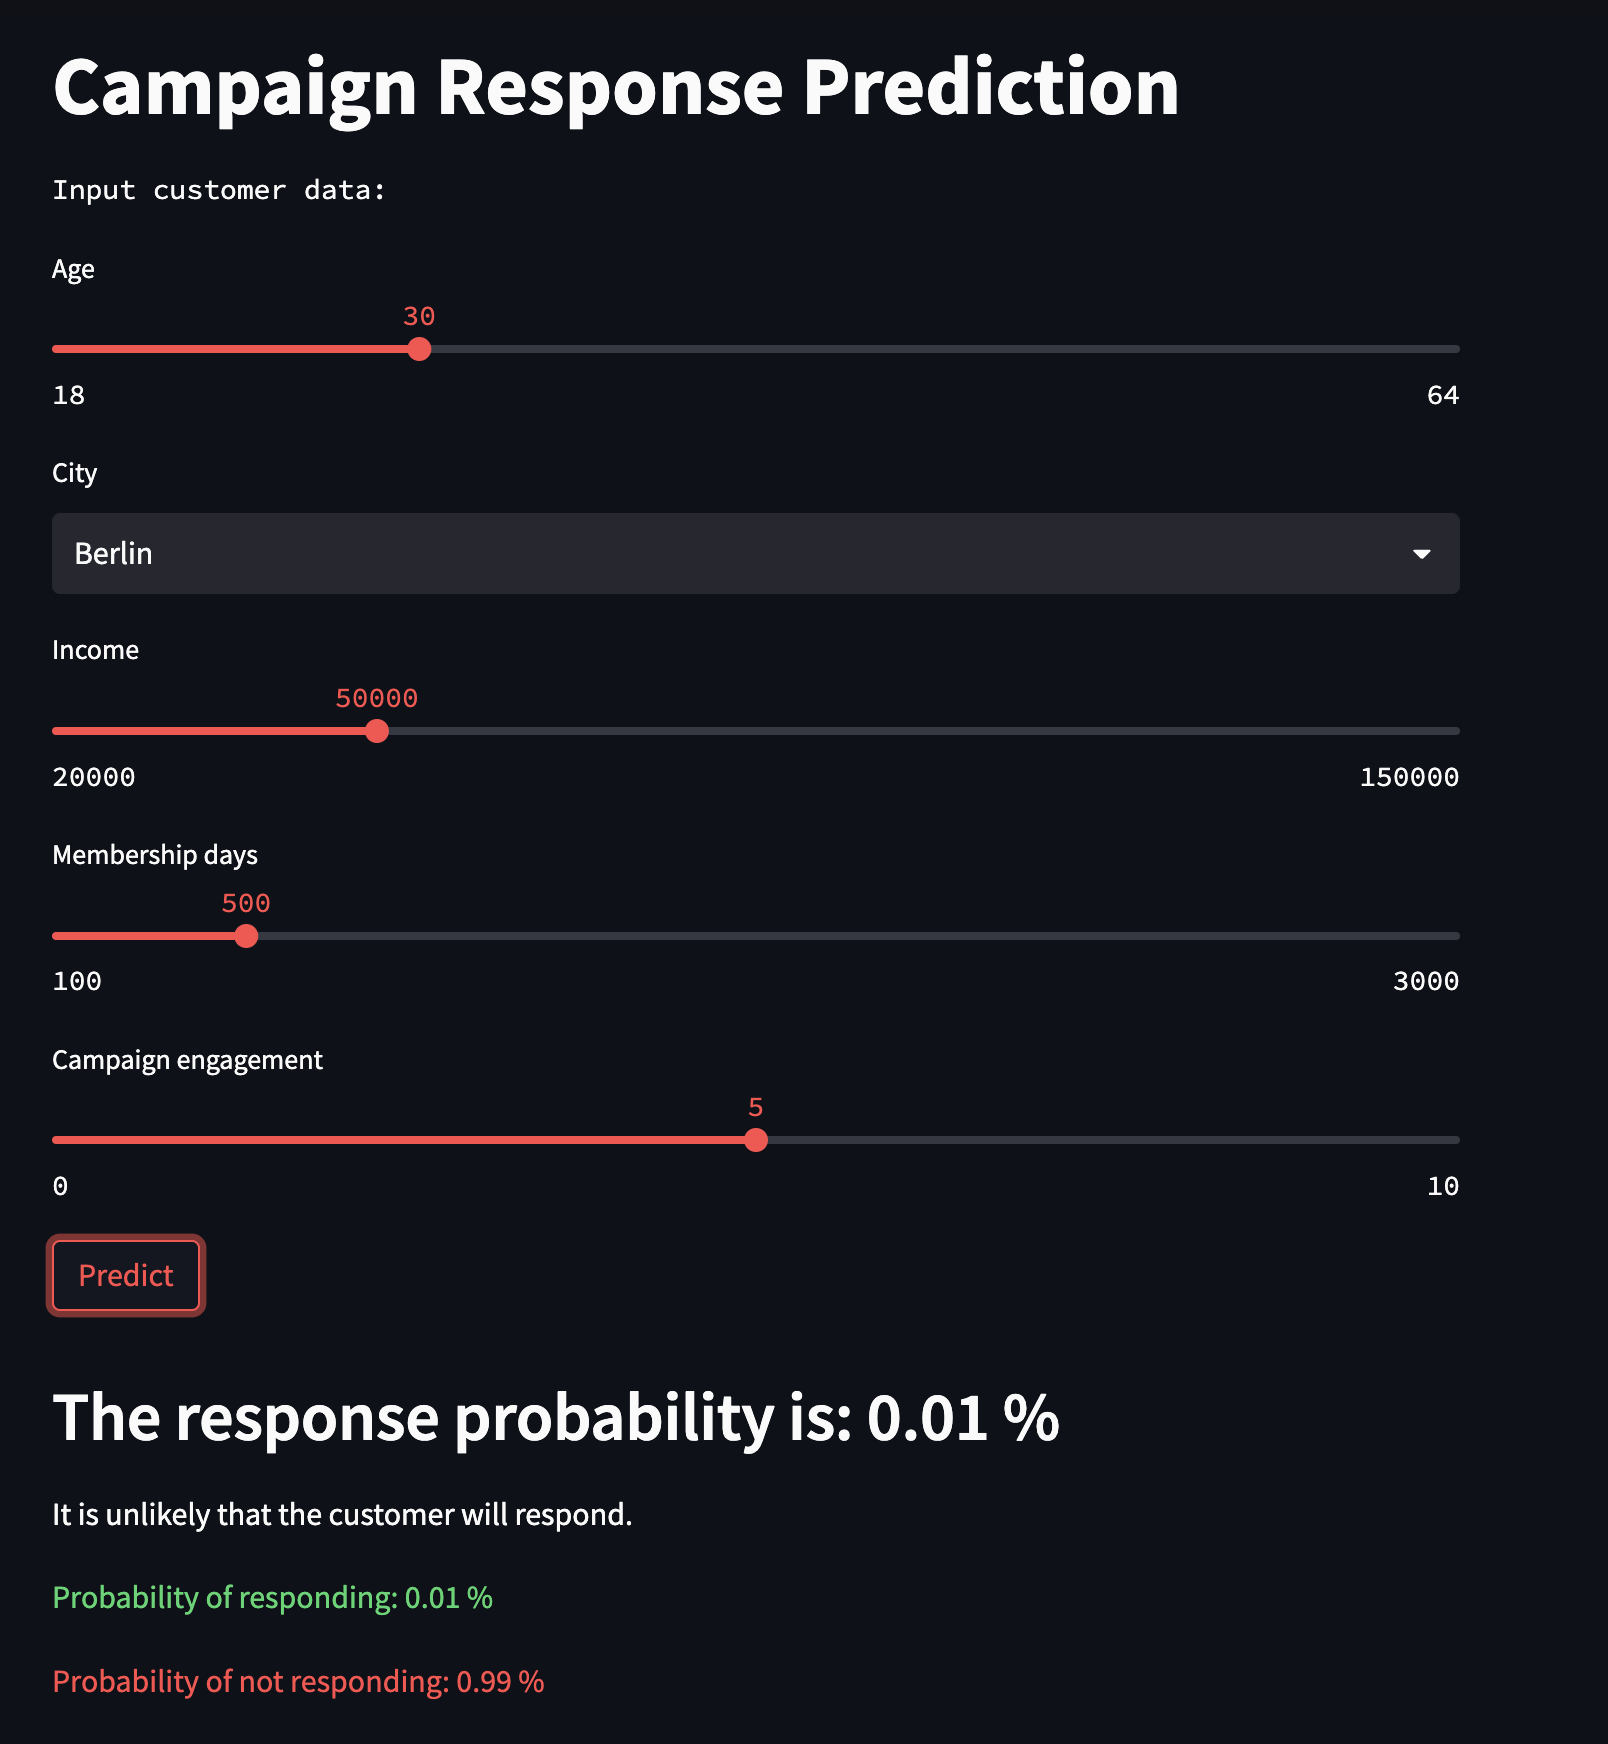
FastAPI
Use an FastAPI app with a single
/predictendpointAccepts POST requests with JSON data containing age, city, income, membership days, and campaign engagement.
The app will return a JSON response with the prediction.
Test API with data
- You can test the API using Python’s requests library:
Get response
Output
Marketing campaign
Next, we would filter all customers at a certain threshold
What would be a good threshold?
Only target those customers with the marketing campaign
Questions?
Jan Kirenz