Logistic Regression
Contents
Logistic Regression#
We use a classification model to predict which customers will default on their credit card debt.
Data#
To learn more about the data and all of the data preparation steps, take a look at this page. Here, we simply import the prepared data:
Import data#
import pandas as pd

df = pd.read_csv('https://raw.githubusercontent.com/kirenz/classification/main/_static/data/default-prepared.csv')
# define outcome variable as y_label
y_label = 'default_Yes'

# select features
features = df.drop(columns=[y_label]).columns.to_numpy()

# create feature data
X = df[features]

# create response
y = df[y_label]
Data split#
from sklearn.model_selection import train_test_split

X_train, X_test, y_train, y_test = train_test_split(X, y, test_size=0.3, random_state = 1)
Model#
Select model#
from sklearn.linear_model import LogisticRegression
clf = LogisticRegression()
Training & validation#
from sklearn.model_selection import cross_val_score

# cross-validation with 5 folds
scores = cross_val_score(clf, X_train, y_train, cv=5, scoring='accuracy')
# store cross-validation scores
df_scores = pd.DataFrame({"logistic": scores})

# reset index to match the number of folds
df_scores.index += 1

# print dataframe
df_scores.style.background_gradient(cmap='Blues')
| logistic | |
|---|---|
| 1 | 0.966429 |
| 2 | 0.965000 |
| 3 | 0.965714 |
| 4 | 0.965000 |
| 5 | 0.963571 |
import altair as alt

alt.Chart(df_scores.reset_index()).mark_line(
     point=alt.OverlayMarkDef()
).encode(
    x=alt.X("index", bin=False, title="Fold", axis=alt.Axis(tickCount=5)),
    y=alt.Y("logistic", aggregate="mean", title="F1")
)
df_scores.describe().T
| count | mean | std | min | 25% | 50% | 75% | max | |
|---|---|---|---|---|---|---|---|---|
| logistic | 5.0 | 0.965143 | 0.001059 | 0.963571 | 0.965 | 0.965 | 0.965714 | 0.966429 |
Fit model#
# Fit the model to the complete training data
clf.fit(X_train, y_train)
LogisticRegression()In a Jupyter environment, please rerun this cell to show the HTML representation or trust the notebook.
On GitHub, the HTML representation is unable to render, please try loading this page with nbviewer.org.
LogisticRegression()
Coefficients#
# intercept
intercept = pd.DataFrame({
    "Name": "Intercept",
    "Coefficient":clf.intercept_}
    )
intercept
| Name | Coefficient | |
|---|---|---|
| 0 | Intercept | -2.995871 |
# make a slope table

coefs = pd.DataFrame(clf.coef_).T
coefs.rename(columns={0: "Coef"}, inplace=True)

features = pd.DataFrame(features)
features.rename(columns={0: "Name"}, inplace=True)

# combine estimates of intercept and slopes
table = pd.concat([coefs, features], axis=1)

round(table, 3)
| Coef | Name | |
|---|---|---|
| 0 | 0.004 | balance |
| 1 | -0.000 | income |
| 2 | -3.961 | student_Yes |
Evaluation on test set#
y_pred = clf.predict(X_test)
# Return the mean accuracy on the given test data and labels:
clf.score(X_test, y_test)
0.968
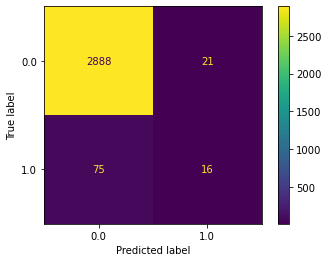
Confusion matrix#
from sklearn.metrics import ConfusionMatrixDisplay

ConfusionMatrixDisplay.from_estimator(clf, X_test, y_test);

Classification report#
from sklearn.metrics import classification_report

print(classification_report(y_test, y_pred, target_names=['0', '1']))
              precision    recall  f1-score   support

           0       0.97      0.99      0.98      2909
           1       0.43      0.18      0.25        91

    accuracy                           0.97      3000
   macro avg       0.70      0.58      0.62      3000
weighted avg       0.96      0.97      0.96      3000
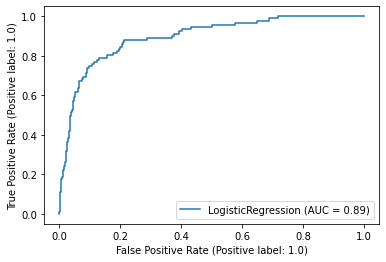
ROC Curve#
from sklearn.metrics import RocCurveDisplay

RocCurveDisplay.from_estimator(clf, X_test, y_test);

AUC Score#
from sklearn.metrics import roc_auc_score
roc_auc_score(y_test, clf.decision_function(X_test))
0.8946921074800072
Option 2 to obtain AUC:
y_score = clf.predict_proba(X_test)[:, 1]
roc_auc_score(y_test, y_score)
0.8946921074800072
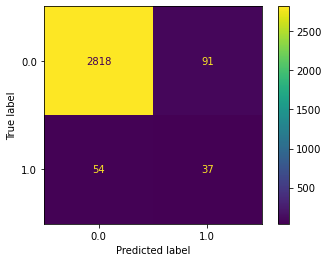
Change threshold#
Use specific threshold
# obtain probabilities
pred_proba = clf.predict_proba(X_test)
# set threshold to 0.25

df_25 = pd.DataFrame({'y_pred': pred_proba[:,1] > .25})
ConfusionMatrixDisplay.from_predictions(y_test, df_25['y_pred']);

Classification report#
print(classification_report(y_test, df_25['y_pred'], target_names=['0', '1']))
              precision    recall  f1-score   support

           0       0.98      0.97      0.97      2909
           1       0.29      0.41      0.34        91

    accuracy                           0.95      3000
   macro avg       0.64      0.69      0.66      3000
weighted avg       0.96      0.95      0.96      3000

