Chapter 5 Density plots
You should use this method if the data is:
- Numeric and continuous
In this chapter you will learn how to do some simple data explorations for numerical variables using density plots.
5.1 One variable
wage_df %>%
  ggplot(aes(x = wage)) +
  geom_density()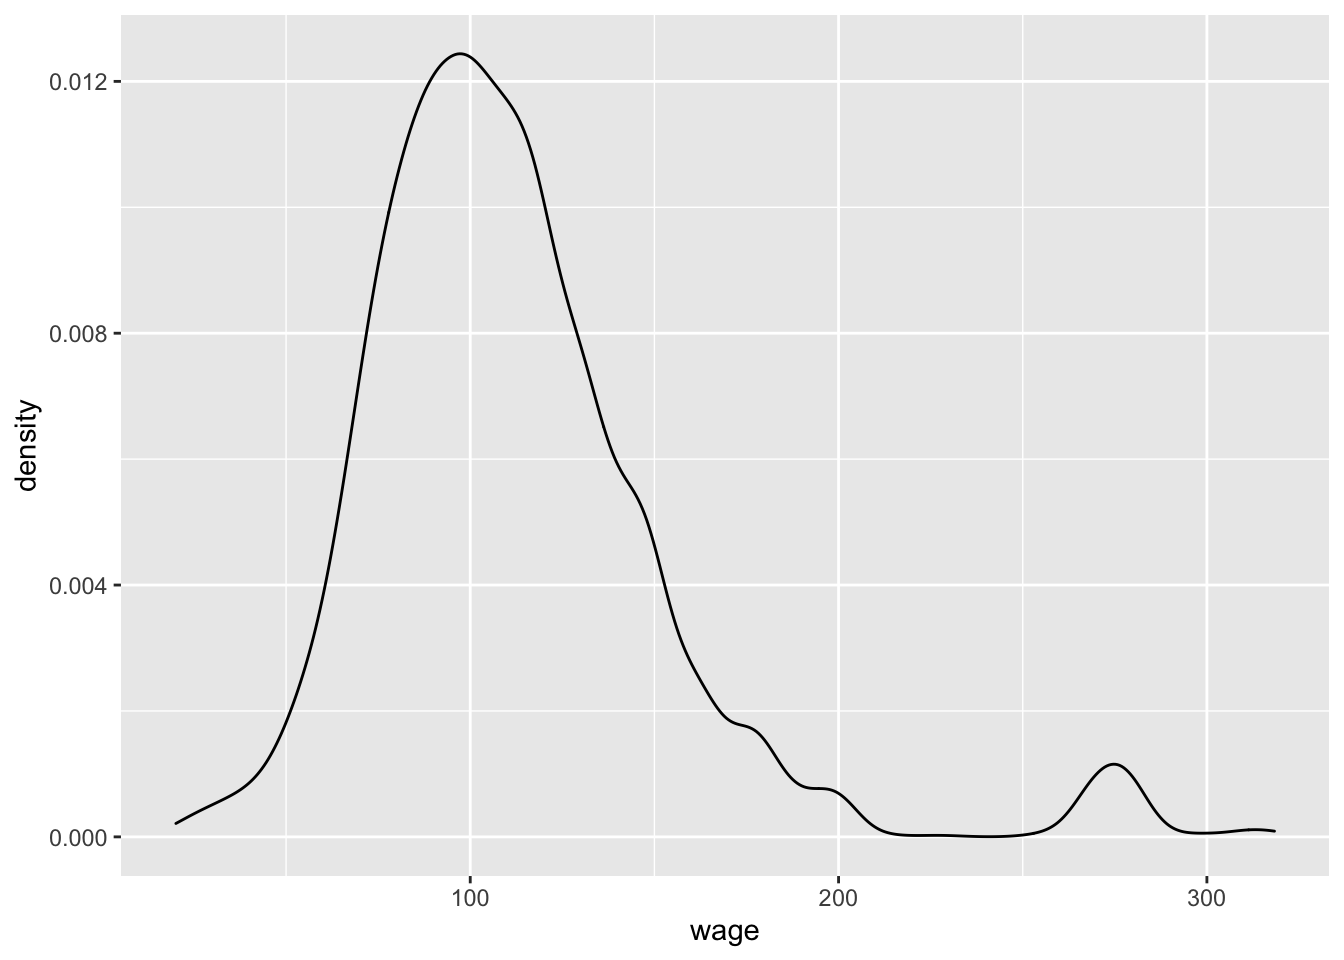
5.2 Two variables
Combine your numeric variable with a categorical variable:
wage_df %>%
  ggplot(aes(x = wage, fill = education)) +
geom_density() 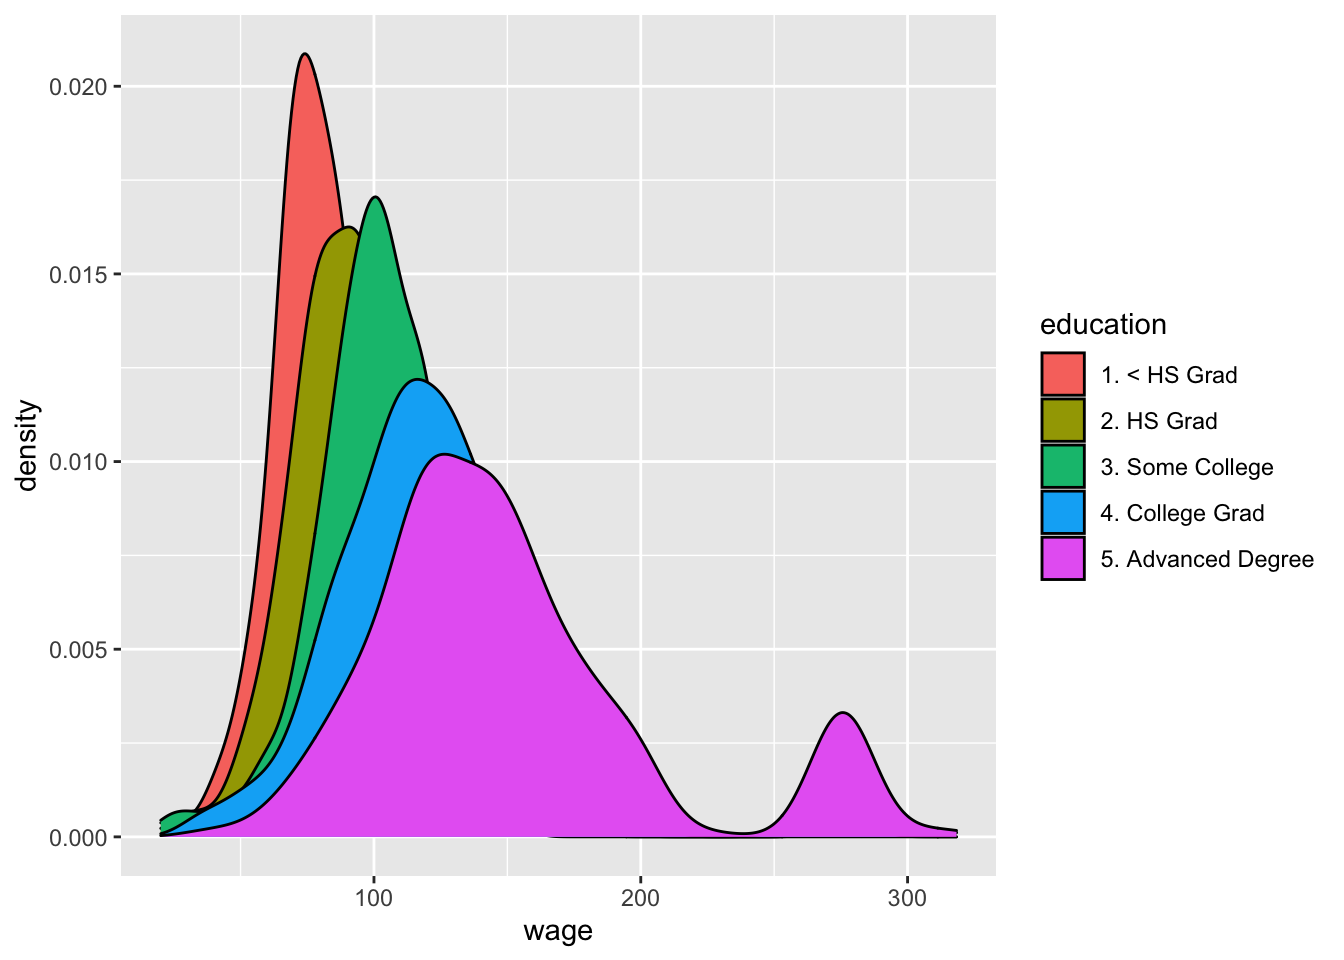
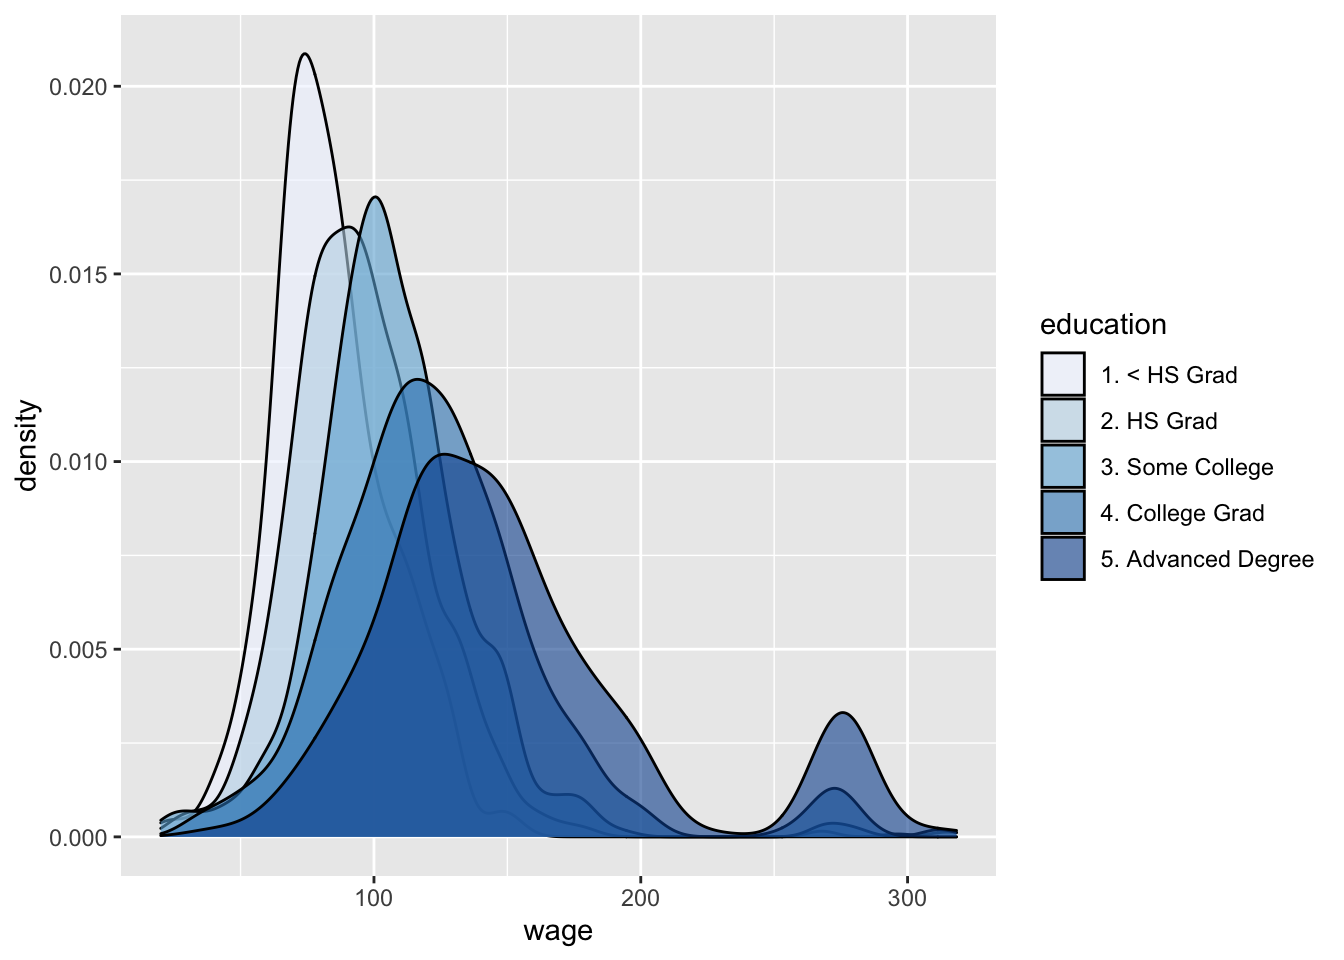
Make some adjustments:
wage_df %>%
  ggplot(aes(x = wage, fill = education)) +
  geom_density(alpha = 0.6) +
  scale_fill_brewer(palette = "Blues")