Chapter 4 Histogram
You should use this method if the data is:
- Numeric
4.1 One variable
4.1.1 Basic Histogram
Basic plot:
wage_df %>%
  ggplot(aes(x = wage)) +
  geom_histogram()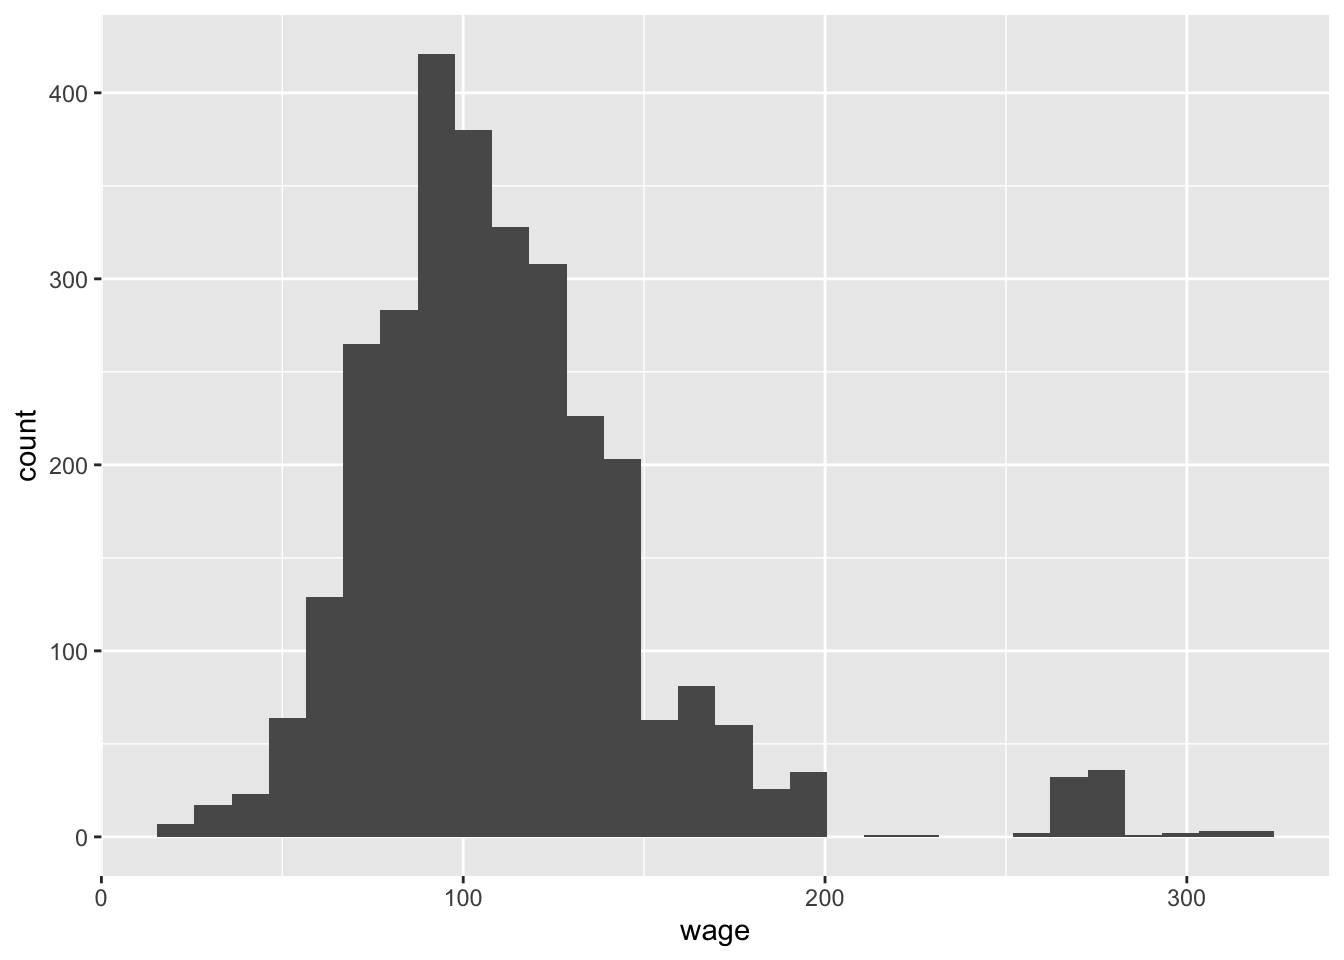
4.1.2 Bins
Adjust number of bins:
wage_df %>%
  ggplot(aes(x = wage)) +
  geom_histogram(bins = 20)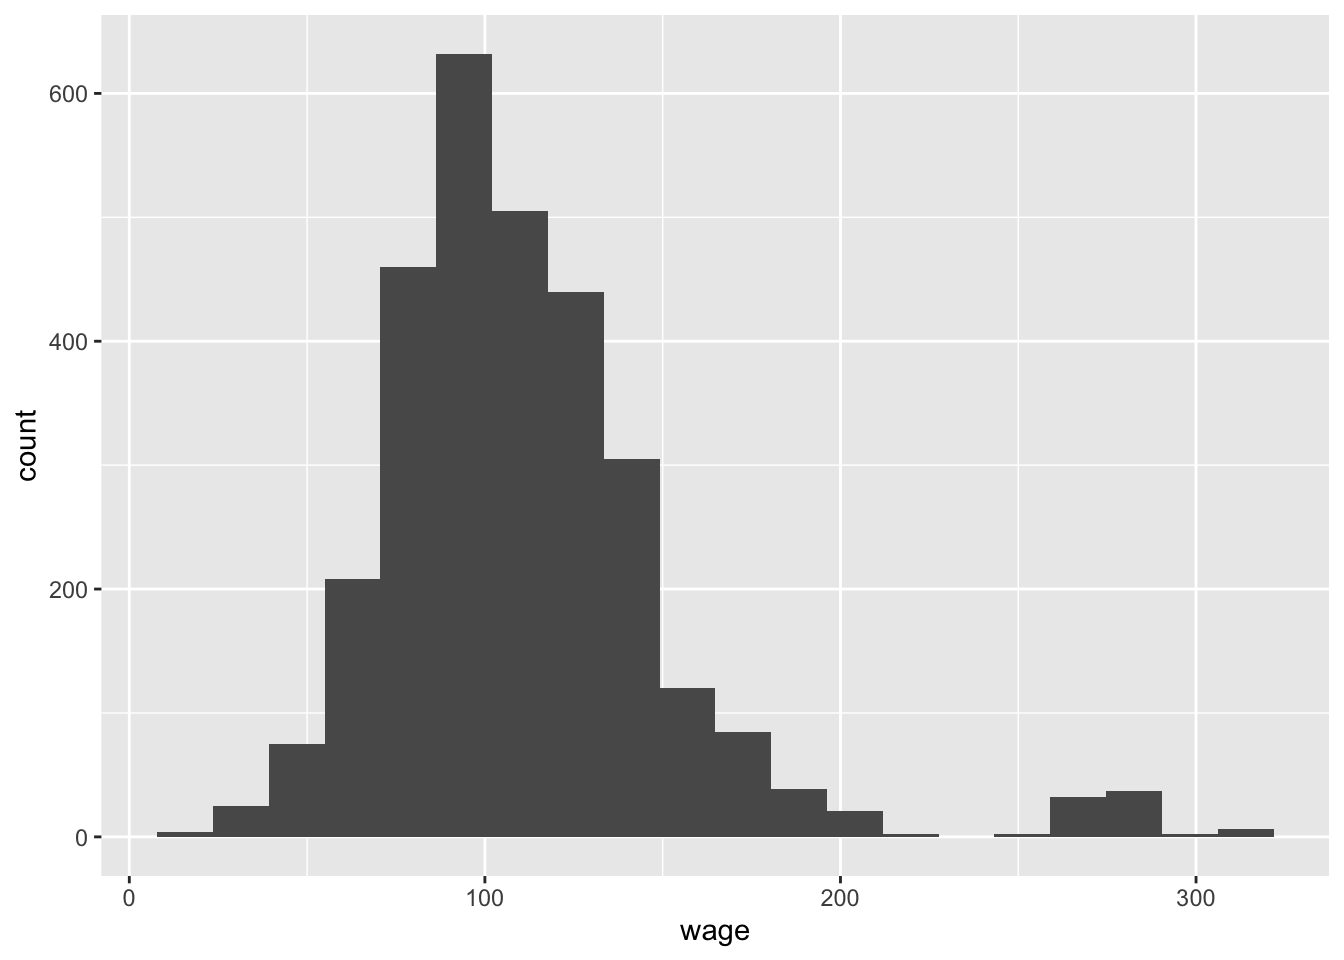
4.1.3 Binwidth
Instead of using bins, you can also change the binwidth:
wage_df %>%
  ggplot(aes(x = wage)) +
  geom_histogram(binwidth = 10)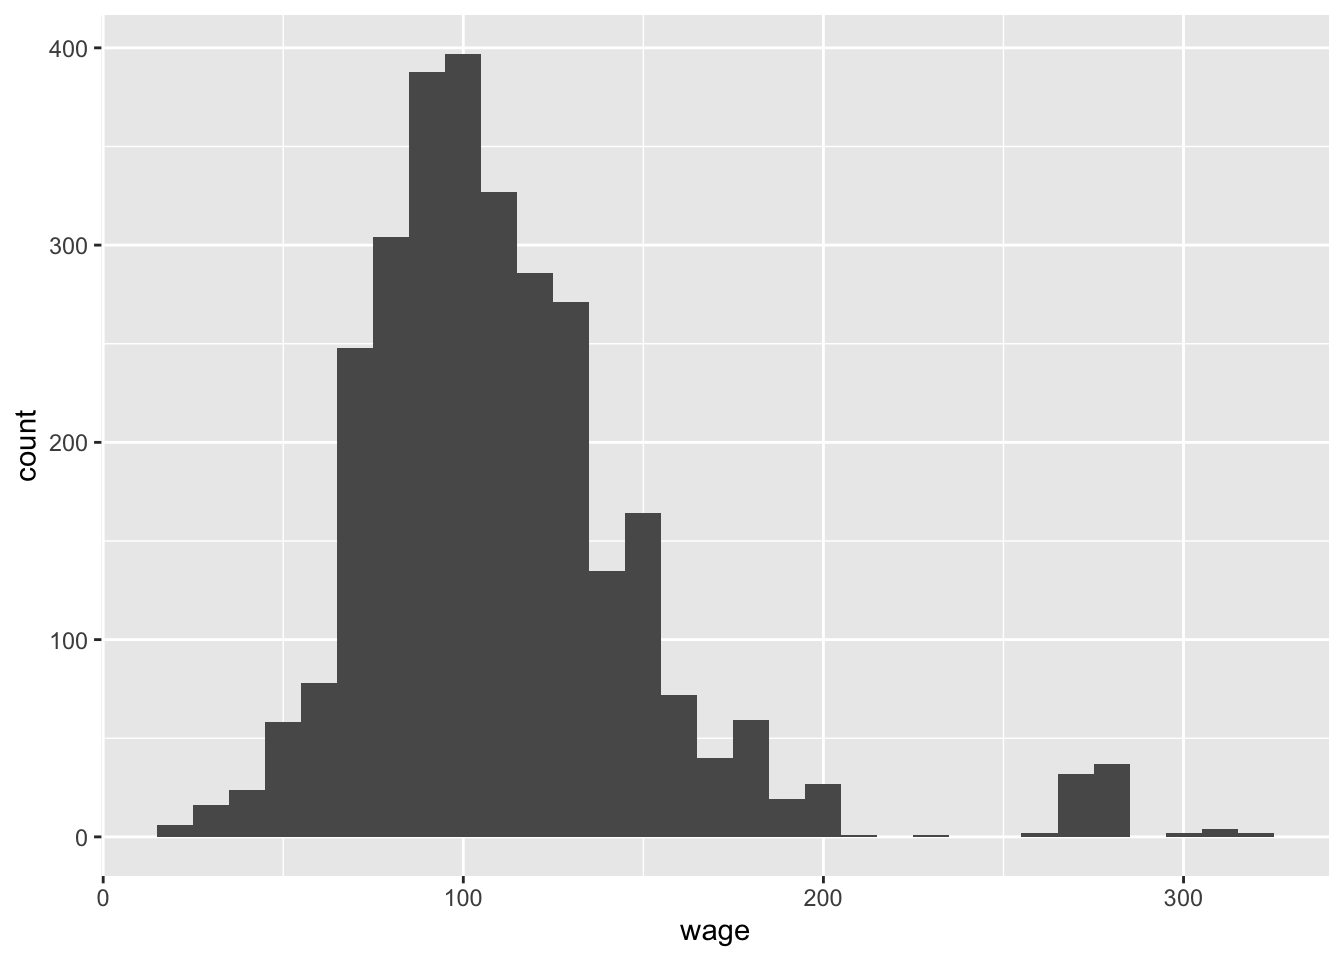
4.2 Two variables
4.2.1 Faceted histogram
wage_df %>%
  ggplot(aes(x = wage)) +
  geom_histogram() +
  facet_wrap( ~ education)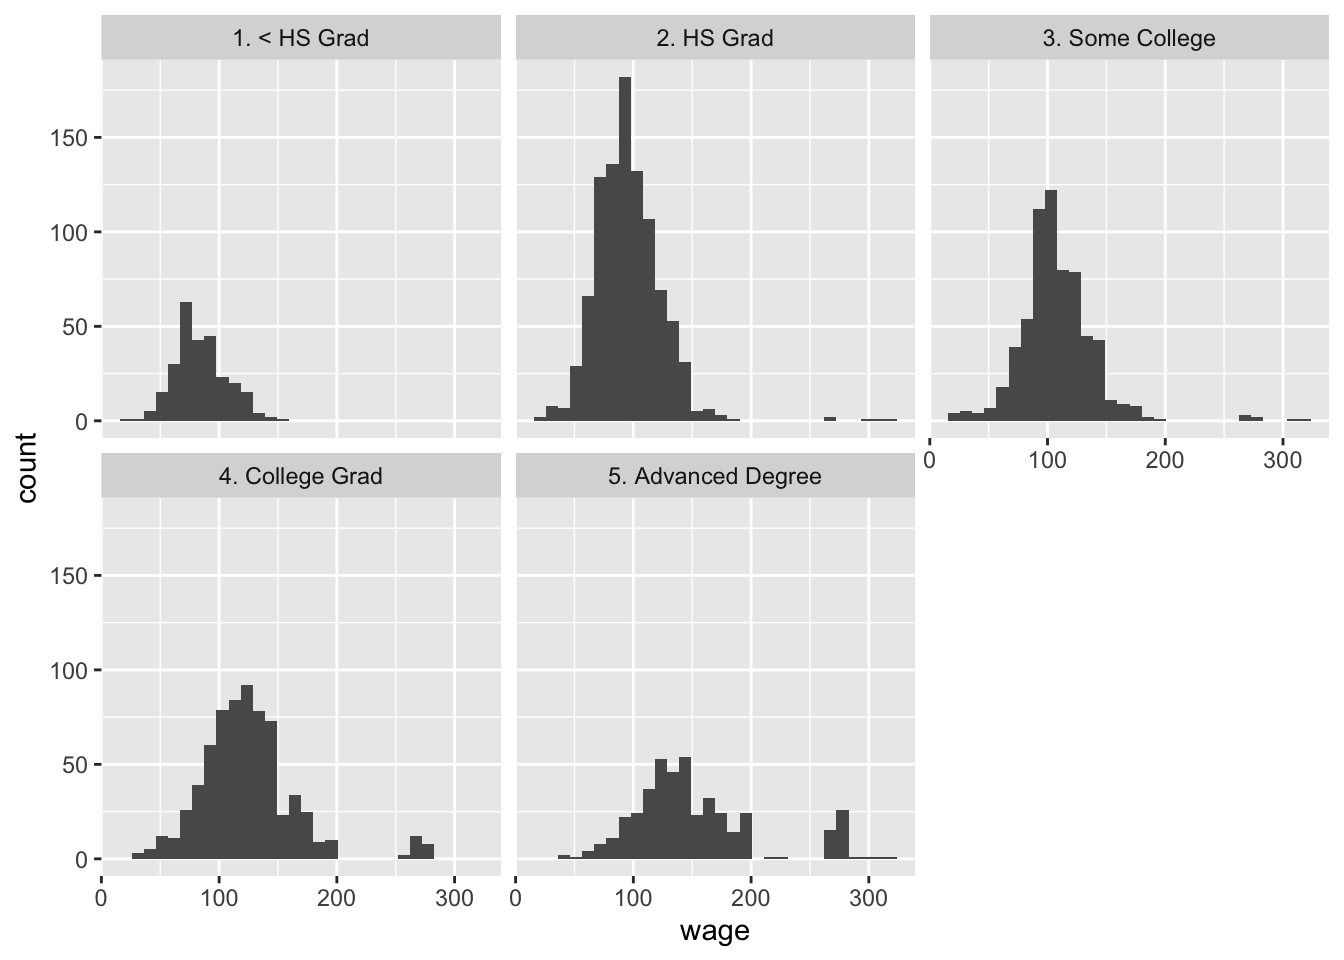
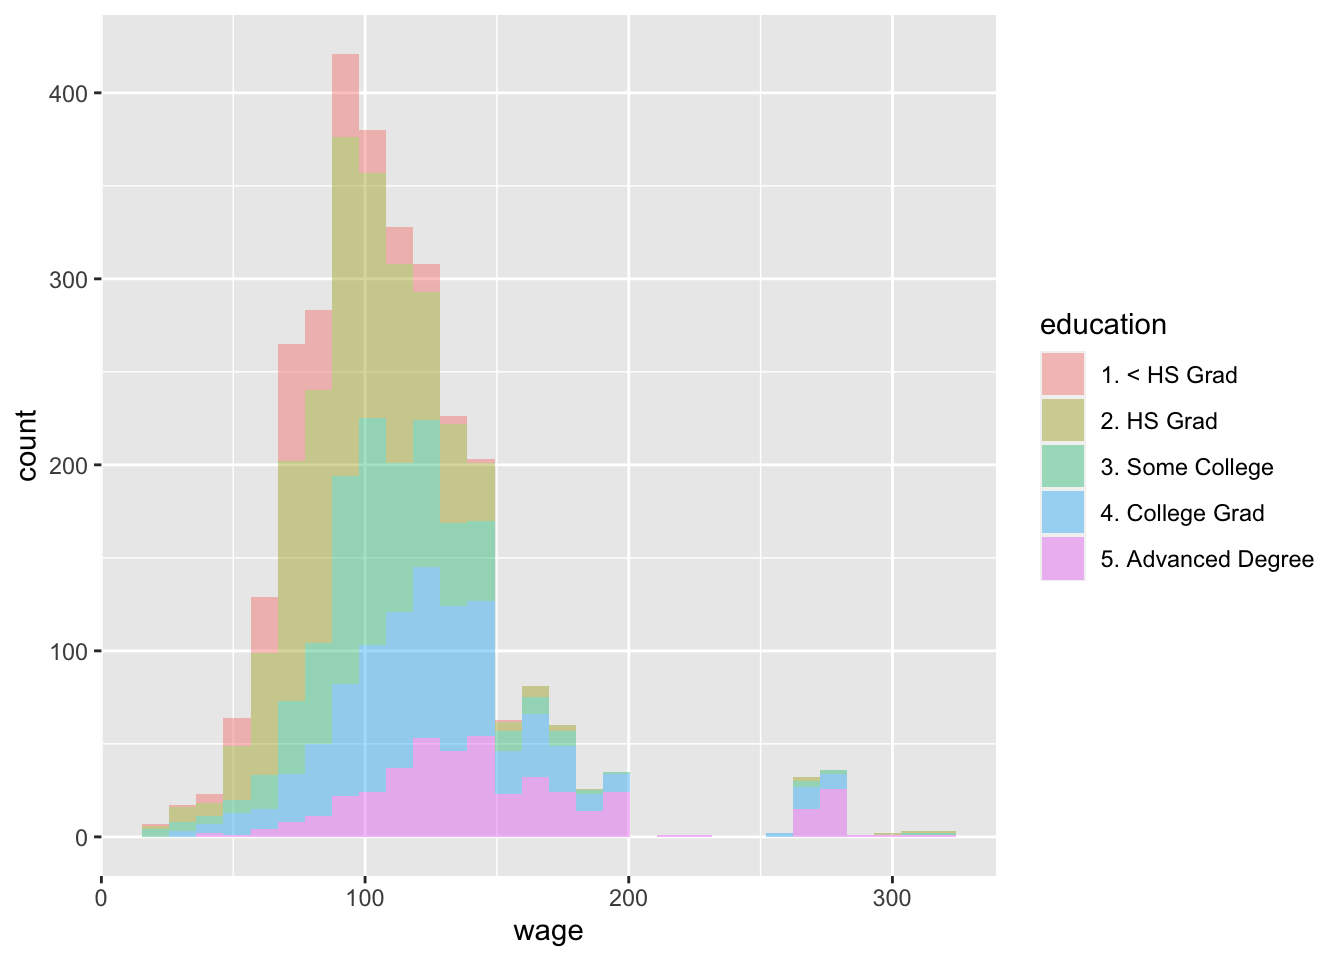
4.2.2 Stacked histogram
wage_df %>%
  ggplot(aes(x = wage, fill = education)) +
  geom_histogram(alpha = 0.4)